management: A Different Set of Goalposts for Application MQ Performance
When you've been working with mainframes as long as I have, you'll have spent a lot of time working on application performance: tuning applications so they work as fast as necessary. However recently I've been working on an application using MQ. And I've found that tuning applications and MQ can be a little different to the tuning I've been used to. Let me explain. |
 |
Traditional Application Tuning
The tuning I've been used to (which I'll call 'traditional application tuning') can be divided into two categories: online and batch. For batch, we're worried about the job's elapsed time – usually to meet a schedule or deadline. For online, we're worried about transaction response times – a user hits a key (or clicks a mouse), and expects something back fast – say, less than a second.
And the path is well travelled. For batch, you look at the step elapsed time, for online the transaction response times. If they're not good enough, you can start your tuning.
An MQ Application
For batch, MQ doesn't make much different. We're still worried about the step elapsed time. We'll be looking at MQ-related things like persistence, message size and syncpoint frequency to speed our MQ gets and puts.
In some cases, online is similar. You may have a CICS transaction that is triggered from an MQ message, so you're looking at the CICS transaction response time. Nothing new.
However, the application I've been working on is a bit different. It's a CICS-based MQ application. But rather than submitting a CICS transaction for each MQ message, one transaction processes a block of incoming MQ messages. Makes sense if you've a lot of incoming messages – no overhead of starting a new CICS transaction every time.
But now we have a situation where a single CICS transaction could process one, 100 or 1000 incoming MQ messages. We can no longer rely on the CICS transaction response times alone.
MQ Goalposts
I know what you're thinking: the CICS SMF records (or more precisely, the CICS Performance Class data written by the CICS Monitoring Facility to SMF Type 110 records) include MQ statistics: number of MQ requests and response times. So, we're good – all we need to do is divide the CICS transaction response by the number of MQ requests, and we're in business.
True response time = CICS 110 Response Time / Number of MQ operations
There is a small problem with this approach. Our application gets messages until there are no more, and then does an MQ Getwait for up to one minute. If more messages arrive in this minute, the same transaction processes them. If not, the transaction ends, and the next incoming message triggers a new CICS transaction. This Getwait time is included in the CICS response times, making our 'true' response time misleading. We can get around this, as the 110 records include the Getwait time (I love CICS SMF records). So now we have:
True response time =
(CICS 110 Response Time – MQ Getwait Time) / Number of MQ operations
This approach could work well if the MQ messages were coming from a person at a screen: they need a set response time, and we can figure it out. But for such 'batching' transactions it's different. Incoming messages are usually from other applications: from within the organisation, or from an external organisation. In many cases, MQ has become a common way for applications in different organisations to communicate.
So, here's the question. When looking at application tuning, the first question is always "where are my goalposts?" What performance do I need? For a CICS online transaction, this is usually a CICS transaction response time. So, a Service Level Agreement (SLA) would have something like “90% of transactions complete within 0.1 seconds”. But what about incoming MQ messages from other applications? Often these are not real-time, but more like "near real-time."
In my example, each message needs to be processed within a few minutes (no specific time limit). But all messages have to be processed by a set time of day. There are many incoming MQ queues with varying processing deadlines.
A Different Kind of Goalpost
So, we could have listed all incoming queues, added their deadlines, and worked from there.

This would have worked out fine but would have been time-consuming and complicated. So, we took a different approach.
From experience, MQ performance problems are rarely from a single message on an otherwise empty queue not being processed fast enough. Rather, the problems occur when queues fill up: when messages enter the queue faster than they're processed. For example, if we have an application that can receive (and process) 10 messages a second, but the queue is receiving 20 messages a second, then we're not keeping up. Allow this to occur for a few minutes and we've got lots of messages on the queue.
When queues fill up, MQ performance suffers as the MQ queue manager does more work. For example, more messages may go to or from the pagesets, and not stay in buffer pools. This can be made worse if the receiving application is not simply getting the next message but searching through the queue for a specific message (though queue indexes on z/OS can help here).
More importantly, a message put on the queue will need to wait for all the messages before it to be processed before it will get its turn. For example, I've seen a case where the application team believed their application was performing well, not realising that at peak times, messages could wait up to 20 minutes in a queue before being processed.
In the end, we decided that a suitable yardstick was this: messages should be processed as fast as they're received. We don't need such performance on a second-by-second basis; averaged over an hour will do. So, if an application receives 60,000 messages in one hour, it should be able to process at least 60,000 messages in one hour to keep up with demand.
This is sufficient for current workloads, but we also wanted to allow some room for growth or spikes in traffic, say 30%. So, the application now needs be able to process 80,000 (130% of 60,000) messages per hour.
Using These Goalposts
Once we have these goalposts, we can start using our statistics intelligently to determine if we're achieving our goals. One way is simply to look at the maximum queue depths for our MQ queue. If it starts getting high, we have a performance problem.
The problem is that this approach can only tell you if there's a problem now. Sure, you can also get historical information if you're keeping the right MQ statistics (we talk more about this in our partner article). But it won't tell you if there's a problem about to happen with a small increase in traffic. Or in other words, it doesn't help with analysis of the capacity of an application servicing an incoming MQ queue.
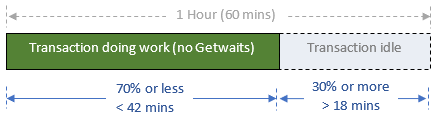
Another way is to look at the CICS transaction response times again. Take away times when the transaction is waiting for MQ traffic (Getwaits), and we can figure out how much time in an hour the transaction is actually performing work. To be able to process 30% more than the peak incoming transaction rate, our processing transaction should be doing real work for a maximum of 70% of the hour (42 minutes - 70% times 60 minutes) and be idle for 30% of the time (18 minutes).
We can even plot this on a heat chart to see when the processing transaction is busy, and if it's getting close to our limit. Here's an example for one transaction.

All the numbers are seconds of actual processing (excluding Getwaits). So, at midnight, our application is only processing for 30-400 seconds in any one hour: no performance issues. However, on 01-Aug between 11:00 and 12:59, the processing is getting very close to our one-hour (3600 seconds) limit - some tuning required.
From here, we followed the normal tuning process for a CICS transaction: looking at the reasons for the response times from the CICS SMF 110 records, and working from there.
Conclusion
There's a lot of information about monitoring queue manager performance and MQ networks. There are also a lot of tools to look at queue depths, status and more. However, I haven't seen anything that talks about application performance, and in particular finding out if the performance of a service task processing incoming MQ messages is sufficient. To my mind, such MQ processing programs need a new set of goalposts to determine if the current performance is good enough. If it isn't, then the normal performance tuning tasks can be used to get the performance to where it needs to be.
David Stephens
|
