LongEx Mainframe Quarterly - November 2012
Most mainframe users are using Sub-Capacity licensing: paying for big ticket software such as z/OS, DB2 and CICS based on the z/OS system CPU usage. Sub-Capacity licensing has changed the landscape for software costs, offering software licensing cost savings for sites that can reduce their processor usage. When tuning to reduce CPU usage, the first step is to get a 'hit list' - a list of high CPU users that could provide the largest CPU savings. This article looks at three different SMF records, and they can, or can't, be used to identify the big CPU users. SMF Type 70SMF Type 70 records have been around for ages - certainly far before I started working with mainframes. This trusty old favourite shows total z/OS system-level statistics. In particular, it shows how log each central processor (CP) was busy, and how long idle. From this information, we can get an accurate picture of the entire z/OS system CPU usage - including batch, TSO, systems and z/OS itself. This doesn't sound too exciting when trying to identify the big CPU users - you need to know CPU usage for each product or address space, not the entire system. However for Sub-Capacity users, Type 70 is your first port of call. 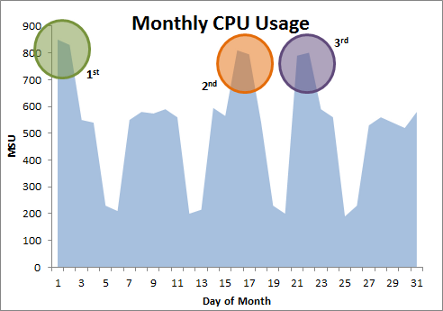
I know what you're thinking: “I can see this from IBMs SCRT output.” And you're right. In fact, IBMs Sub-Capacity Reporting Tool (SCRT) uses Type 70 records itself to find this information. However some users, such as outsourcing customers, may not get to see SCRT reports. And personally, I like to see an overall picture in case there are some extra peaks that don't show up in SCRT reports. There's not much point tuning one peak when there's a second peak almost as high. In this case, both peaks must be tuned together. So armed with a graph like the one above, I can pick periods to tune. SMF Type 89It's easy to get excited about SMF Type 89 records. A relatively new record type, it stores the CPU of each registered Sub-Capacity product over time. This is the mainstay of IBMs SCRT tool, and must be activated in any Sub-Capacity system. Any Sub-Capacity software product registers using the IFAUSAGE macro, and voila! Type 89 records are recorded for that product. Reporting software such as Merrill's MXG, IBM TDSz and CA MICS all include features that can be used to process SMF Type 89 records. But here's the thing - I'm not a fan of Type 89 records. Sure, they sound exciting, but they only show the CPU usage for a total product. And yes, from APAR OA31615 in 2011, they also show zAAP/zIIP time. But that's where it ends. Want to know which IMS address space is using all the CPU? Type 89 can't help. Want to know what could have been offloaded to a zAAP/zIIP if one was installed? No use here either. The biggest disadvantage is that SMF Type 89 only records registered Sub-Capacity product use. So if a non-Sub-Capacity or home-grown module is pushing up your CPU usage, SMF Type 89s won't help you. The good news is that there's an SMF record that will. SMF Type 30SMF Type 30 records report CPU usage for each job step. There are a couple of types, but the most interesting for our purposes is the Type 30 Interval record. This record is produced regularly (how regularly depends on your SMFPRMxx parmlib member, but usually every 15-30 minutes), or at job step end. So using SMF Type 30 records, we can find the CPU used for each job step every 15-30 minute period. All reporting software includes features to process SMF Type 30 interval records. However there will be a lot of these records - and I mean a lot. To handle this, I first select a 1-2 hour period that I am about to tune. This is where that graph I created earlier from Type 70 records comes in. I then collect all the SMF Type 30 records for that period, and process them to produce a list like this: CPU Usage between 10:00 and 12:00 13-Nov-2012
This doesn't look particularly helpful does it? No job names, no timestamps, nothing. However it's all we need to identify the big CPU users. When tuning for CPU, we're looking for programs that are consuming a lot of CPU. And by program, I mean the program from the EXEC PGM=xxx JCL statement for the job step. Now, some of these programs will be long running programs called once. CICS is a classic example of this. However some may be short running programs called many times. A program using only 1 CPU second, but called 2000 times is just as interesting as a single program using 2000 CPU seconds. To give an example, at one site I found a home-grown assembler program, called from automatically submitted batch that consumed only one CPU second each time. However this batch job was called over 2000 times during a one-hour peak window. Yes, after finding it, I spent the next few days reducing that program's CPU usage. So, we now have a list that shows the big CPU using programs over our 1-2 hour period. We need to translate these programs into something a little more useful. How can we do this? Manual labour. With experience, I know most of the program names, and can find out the rest by tracking down the job running the program, or the library name holding the module. For example, DFHSIP is CICS, DFSRRC00 is IMS, DSNYASCP is DB2, and ARCCTL is DFSMShsm . The SMF Type 30 record also has the job name and RACF user name, which may help in identifying the product. Once I know what each high-using program is used for, I can then drill down further. And our SMF Type 30 records can also help here. They record information including the JES job identifier (which can be used to determine the type of job: batch, TSO user, APPC task, USS process etc.), the zAAP/zIIP eligible CPU time (if you want to see if buying a zAAP/zIIP will save you money), and even I/O counts (in case you're also paying by EXCPs). So if CICS usage it high, I can find the CICS region responsible, and then use CICS monitors to find out more. Similarly if IMS usage is high, I can determine if it is the IMS control region, DBRC, MPPs or BMPs. From there, I can do more detailed analysis. ConclusionWhen tuning mainframe systems, sometimes the basics are still the best. Although there are a lot of software products and tools to help you tune your mainframe systems, old-fashioned processing of SMF records is still one of your most powerful tools. Whenever attempting a project to reduce CPU usage, the first step is to find the big CPU users. Basic processing of SMF Type 70 and 30 Interval records can be used to find the programs using the most CPU. From here, more detailed tuning can be done to reduce their consumption. |