technical: Practical Uses for MQ SMF Data
Those of lucky enough to work on z/OS have some advantages when it comes to monitoring IBM MQ: SMF. Forget reading queues with monitoring events, or 'sampling' information at set intervals. MQ on z/OS saves it all on SMF - if you set it up right.
Now, there is a lot of information about how to setup these records and obtain the data. But what can you do with this data? In this article, we'll take a look at some ways we've used this data in the past.
Quick MQ SMF Record Introduction
Let's give the Cliff Notes about MQ SMF records. There are two MQ SMF records:
Type 115: Statistics records. These are queue manager level statistics. There are a couple of different subtypes:
- Subtype 1: storage and log records
- Subtype 2: buffers (if in V7 mode or older), messages, locks, coupling facility statistics and more
- Subtype 215: buffers (if in V8 mode or higher)
- Subtype 231: channel initiator statistics (new in V8)
Type 116: Accounting records. These are more detailed statistics: often down to the queue level Again, a couple of subtypes:
- Subtype 0: MQPUT/MQGET statistics. One per task disconnection
- Subtype 1: information for every task and queue
- Subtype 2: extension of subtype 1 if a task uses more queues than can fit in subtype 1
- Subtype 10: channel initiator
Type 115 Examples
SMF 115 records are queue manager level statistics, and everyone should turn them on. The overhead in producing these records is small, and there aren't too many SMF records written.
There are a lot of ways to format these records, including the MQ SupportPac MP1B available for free. However, I tend to use Merrill MXG when I can.
So, let's look at some interesting information from 115 records. The graph below shows the percentage of buffers available for buffer pools 0 and 1. MQ starts to write older messages to DASD when this number drops below 15%. Both buffer pools, including the system-oriented buffer pool 0, are getting close to this value: not ideal.

So, 115 records from the Buffer Manager are great for monitoring buffer pool performance. The graph below shows statistics from the Log Manager:

In particular, it shows the number of times each hour that MQ had to wait for an available output log buffer. If this value is too high, it can indicate that log performance is impacting MQ performance. Good to know.
The text below shows the formatted output of Storage Manager statistics from the MP16 SolutionPac:
MVS1,MQ01,2017/10/31,21:29:28,VRM:810,
  Fixed pools   : Created     19,  Deallocated     19
  Fixed segments: Freed        0,  Expanded        44,  Contracted    4
  Varbl pools   : Created  12134,  Deallocated  12134
  Varbl segments: Freed    60267,  Expanded     60274,  Contracted    6
                 Getmains   1513,  Freemains     1505,  Non-zero RCs  0
                 SOS           0,  Contractions     0,  Abends        0
There are many Share presentations and other documents telling you all about the values. The particularly interesting ones are the SOS (short on storage) and contractions: indicating that there is not enough storage available to MQ. To be honest, other than doing a spot check on these values, I don't normally spend much time with the storage reports for 115 records.
The following graph is from the Message Manager statistics:

It shows the number of MQGets satisfied from a buffer pool (blue), and from disk (orange). In this example, almost all MQGets are from buffer pools, which is what we want. If many are coming from disk, it could be a sign that buffer pools are not tuned correctly. And there are many similar things that can be determined from the message statistics. For example, the number of opens/closes indicates if most activity is from long running tasks (CICS), or shorter running tasks (clients, batch).
Type 116
116 for me is where things get really interesting. But first, the bad news. 116 records are heavier, and there are a lot of them. IBM estimate a 5-10% CPU overhead when enabling these accounting records. But perhaps the biggest shock to anyone enabling them is the number of records produced. Basically, there is one subtype 1 record written for every task, with statistics on every queue used.
I've heard of sites where their SMF recording has 'broken' with the number of 116 records produced. IBM even have a section in their MP16 Capacity Planning and Tuning SupportPac where they talk about when the number of 116 records produced exceeds the maximum MQ can actually write. This limit is higher if using logstreams, and even higher if using SMF compression (preferably with a zEDC card to reduce the CPU overhead).
But the benefits can justify the costs. Let's take an example. The graph below shows the message residency time: the averages of maximum and minimum time a message has remained on the queue (queue ageing). And these figures look OK: up to 35 seconds. This information was the average for all queues in an application. However, values for individual queues can also be obtained.
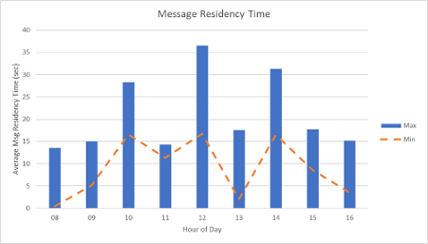
Many sites have performance statistics for CICS, IMS and other subsystems. So, they know how long it takes to process a message. But the time a message waits on a queue can be a surprise. In one site, we found messages waiting for up to 20 minutes during peak, and we estimated that this would increase to 40 minutes with workload growth. A surprise to the application group.
The table below uses this ageing data together with defined maximum queue depths to estimate what would happen if the process draining a queue failed: how long messages could be added to the queue before the maximum queue depth was reached, and incoming messages would be rejected
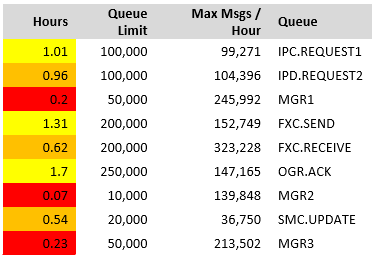
This is interesting. The transmission queue to remote queue manager MGR2 would fill up in 0.07 hours (4.2 seconds) if the channel failed. Similarly, the queue FXC.RECEIVE would fill up in 0.62 hours (37 minutes) if the processing application failed. It may be worth increasing the maximum queue depth of these queues.
The following graph shows information about MQGets, averaged for all queues in an application.

So, we can see that there is around 200,000 MQGet calls (MQGET and MQGET1) every two minutes. With the largest message obtained averaging around 450 bytes. Well, this is great, but how can we use it?
I'm currently working on a project where the client is converting some queues (but not all) in a queue manager to shared queues. To size the coupling facility structures, you'll use the IBM CFSizer application. For the MQ application structure, you'll need to know the average arrival rate, and average size of those messages.
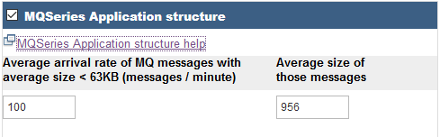
You guessed it, this information can be estimated from 116 record information.
Another reason for this information is to check the size of your pagesets. Nothing more embarrassing that a queue manager running out of pageset space. Again, information about the message rate and size for each buffer pool can be used to estimate the required size for each pageset.
SMF Record Implementation
So, 115 records have minimal overhead, and should always be enabled. But 116 (and in particular, subtypes 1 and 2) have a large overhead, and produce a lot of data. And this is why most sites don't activate them.
So, what can we do? One idea is to rotate queue managers. So, in March, queue manager 1 enables 116 records (but all other don't), in April queue manager 2, and so on. Another option is to turn on statistics for short periods. However, with this latest option, you'll still want statistics during your peak periods.
Conclusion
SMF 115 records are usually enabled by default and give some great queue manager-level statistics about messages, logging and more. However, for effective capacity planning, data from the SMF 116 records is essential.
David Stephens
|
